May 30, 2022 By Team YoungWonks *
In today’s time, more than 60% of the data scientists and developers use the Python programming language as a tool for data science and machine learning. The usage of this language is expected to increase in the future. There are a huge number of datasets available. Therefore, looking for datasets over the web is time consuming and tedious. To solve this problem, the pydataset library was introduced. This collates all the available datasets for a user-friendly experience. Having a pydataset library in python was influenced from R programming language which has its in-built rdatasets.
This tutorial provides information on how to access built-in datasets to use it for data analysis and visualization. Using the pydataset library makes it easy to access datasets. It also saves time and allows hassle free experience to perform data analytics and machine learning algorithms. It is a collection of publicly available datasets and has approximately 700 datasets. Pydataset library loads the data as a dataframe structure. Dataframe structure is the arrangement of data in a tabular format. Datasets can be loaded and used with a few lines of code. Now that we have understood the importance of this library, let’s look into how to use this library.
Basic Requirements
Install Python on your computer. Follow the steps given below to install Python on your system just in case you don’t have it installed.
1. Click on this link https://www.python.org/downloads/
2. Chose an appropriate file to download based on your operation system i.e., Windows, Mac or Linux.
3. Once the latest Python version is downloaded, install Python using the prompts. If you are on Windows, make sure to tick the option “Add Python to path”.
You will also need Jupyter notebook on your computer. This tutorial demonstrates the usage of the library in a Jupyter notebook.
Follow the steps given below in case you don’t have it installed.
1. If you are using the windows operating system, open command prompt and if you are on a Mac, open the terminal to type in the below command.
2. Type ‘’pip install jupyter’’ to install Jupyter notebook. Once it is installed, successfully installed message will show up.
3. In order to use the notebook, open command prompt or terminal based on your operating system and type ''jupyter notebook''.
Now we have our system environment ready to install and use the pydataset library.
Installing the package
In order to use the free inbuilt datasets available in Python, we need to install the library using the command given below.
If you are using the windows operating system, open command prompt and type the command given below. If you are on a Mac, open the terminal to type in the below command.
Windows: pip install pydataset
Mac: pip3 install pydataset
Don’t forget to try out the code on your computer as you read this blog to get hands-on experience.
Importing the package
To start with, you can use jupyter notebook to work on the basics of data analytics. Jupyter notebook is an interactive web tool which will allow you to view the result of the code inline. There is no dependency on other parts of the code as you can run it cell by cell. For huge datasets, Jupyterlab can be used, which is the latest web based interactive development environment. In Jupyterlab, csv data can be viewed in a much more organized manner as it loads the data in a tabular format just like excel unlike jupyter notebook which loads csv files as text files.
from pydataset import data
Load the list of datasets using pydataset
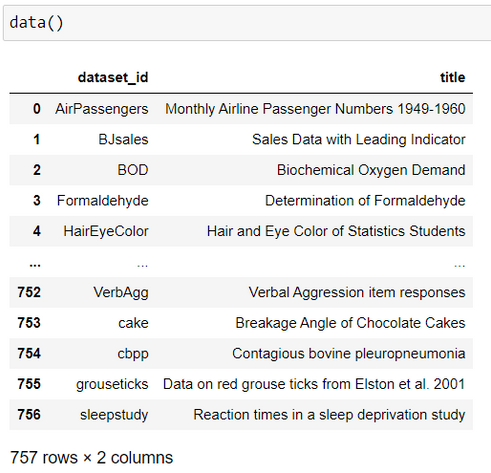
1. All available datasets are loaded by calling an in-built function of the module. This displays all the datasets available in this library. It returns a dataframe containing the dataset id and title.
data()
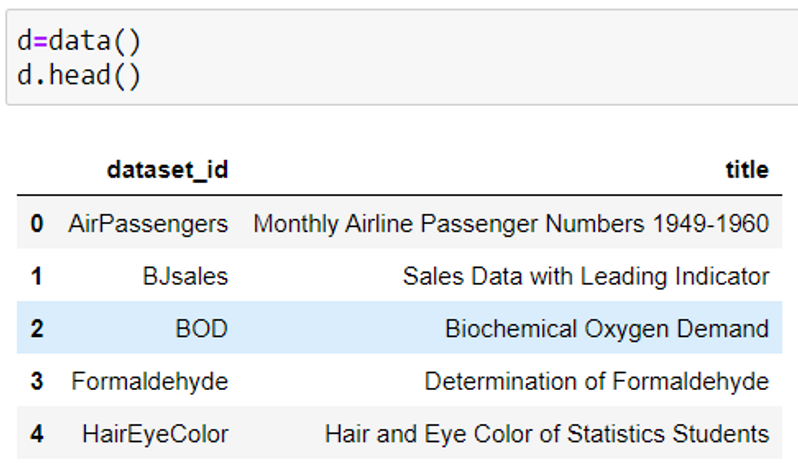
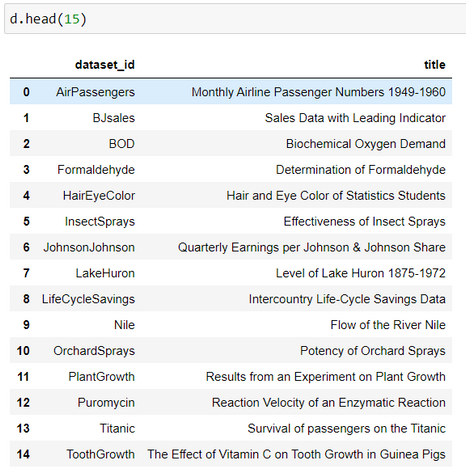
2. To view the names of the first few datasets from the package, use the code given below.
data().head() #by default loads the first 5 datasets
data().head(n) #loads the title and id of first n datasets
3. To view the names of the last few datasets from the package.
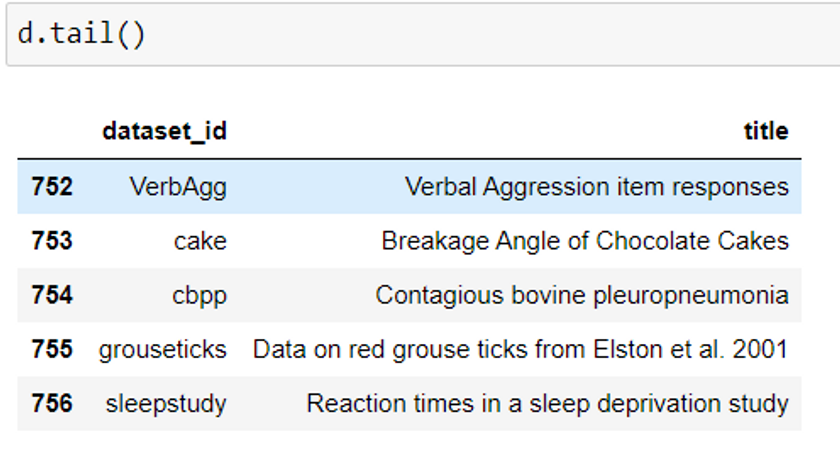
data().tail() #by default loads last 5 datasets
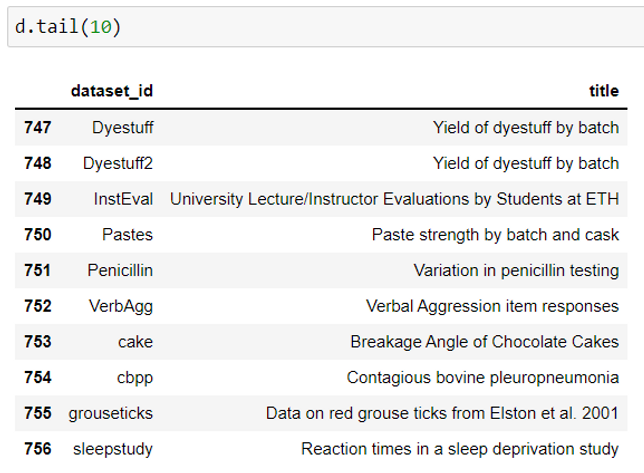
data().tail(n) #loads the title and id of last n datasets
Load a dataset in python using pydataset
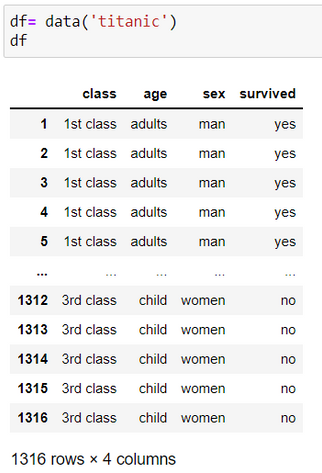
Create a dataset object to load the required data. The dataset is loaded in a pandas dataframe structure. Exploring data analytics, visualization and machine learning is easier using pydataset library as pydataset does not require you to read a csv file or other files such as json, excel using read_csv method in pandas.
df= data(‘dataset_name‘)
Here, we will be using the titanic dataset as an example.
Display the column names of the loaded dataset
df.columns
This returns a list of column names. Columns present in a dataset describe the data and are metadata. Theoretically, metadata is known as "data of data”. Metadata is of great importance and is significant in data science as it allows us to understand the data better. This in turn helps us to read the data better, perform efficient machine learning algorithms and build models. For example, the titanic dataset contains columns such as age, gender, etc. which allows us to understand the collection of data better. So, choosing appropriate columns for modeling is a primary requirement.
Display the data of a specific column
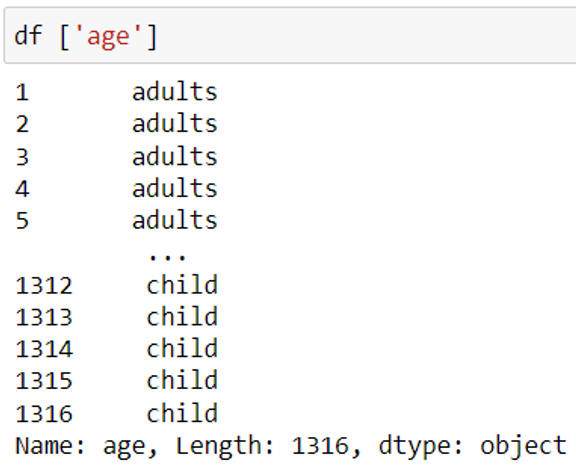
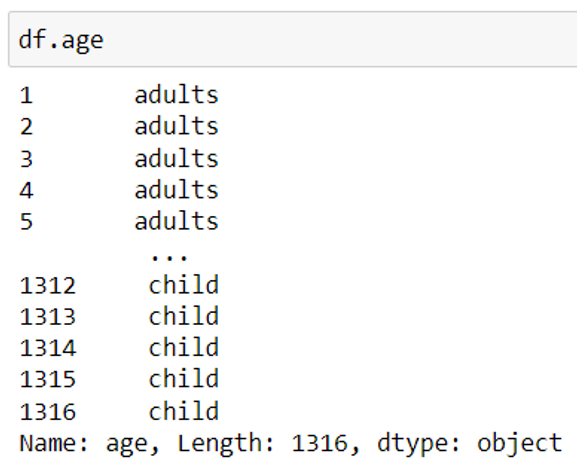
df [column_name] or df.column_name
To view the values of a column, use the column name/header. In order to view multiple columns together, pass the column names/header as a list.
Print the data type of all the columns from a dataset
Any column in a dataset is either numerical or categorical. This implies that numerical columns contain integer or float values whereas the categorical columns have string values.
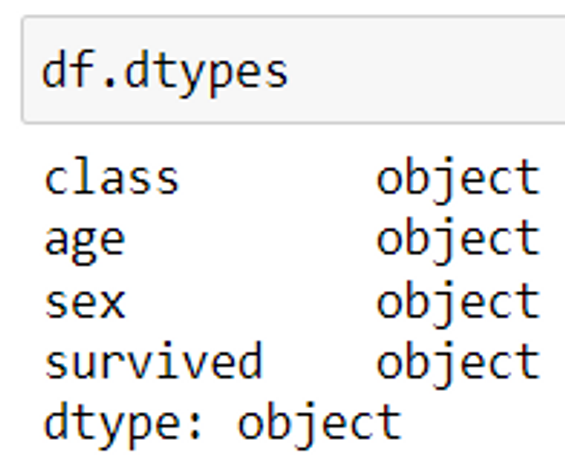
df.dtypes
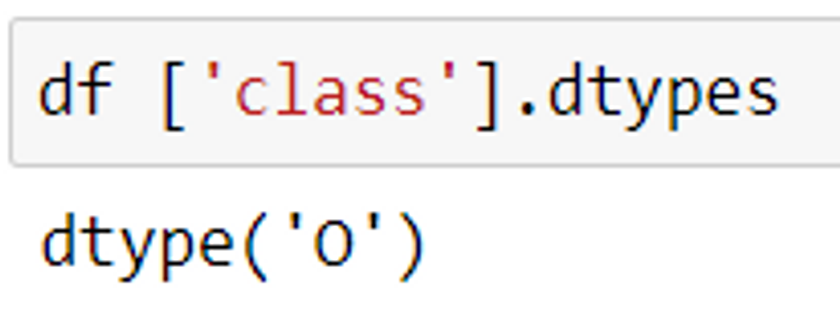
The above code returns the data type of each column present in a dataset. Note that the data type of categorical columns is returned as an object.
df [column_name].dtypes or df.column_name.dtypes
Find all the basic information about the dataset
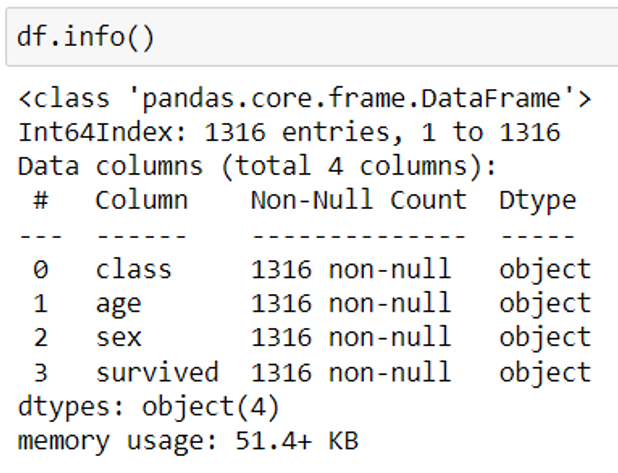
1. To view the total number of values in the dataset, the number of null values and the data type of each column, use the code given below:
df.info()
2. To find the statistical data of the numerical columns:
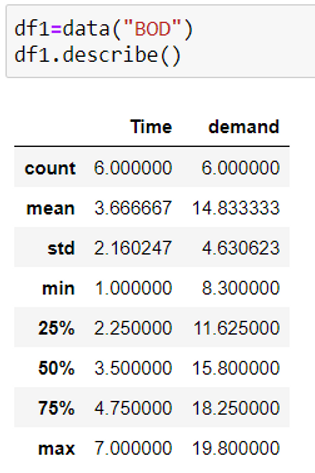
df.describe()
describe method helps us to determine the maximum, minimum, mean, median, quartiles and standard deviation for all the numerical columns of the data.
Here, we are using the BOD dataset as an example.
3. To find the statistical data of categorical columns:
df.describe(include=’all’)
It displays the frequency and unique value count for all the categorical columns. include = ‘all’ displays the stats of both the numerical and categorical columns.
Plot graphs without using matplotlib library
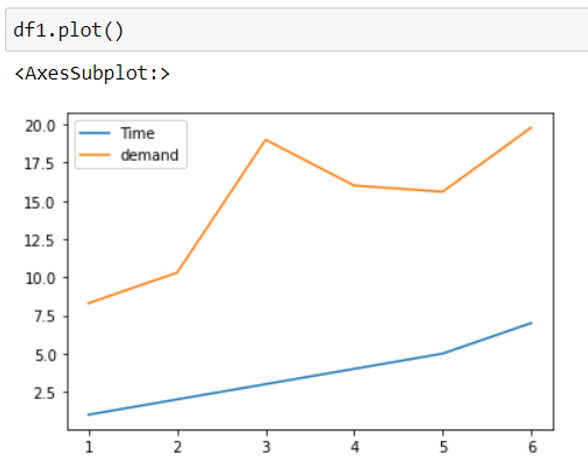
Plotting graphs using the data is the key for data visualization. Using this library gives an upper hand, as datasets are loaded in a pandas dataframe directly which will allow you to visualize data. So, it is a good idea to use this library.
df.plot()
Plot graphs using matplotlib library
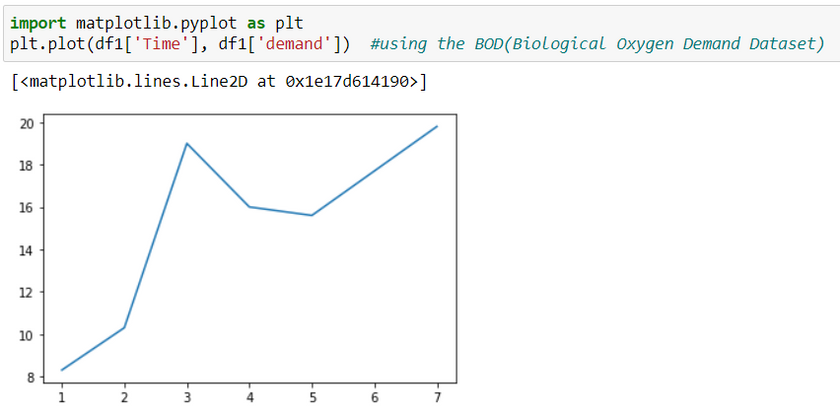
import matplotlib.pyplot as plt
df = data('dataset_name')
plt.plot(df['column_name1'], df['column_name2'])
Time column will be represented on the x-axis and demand will be on the y-axis.
You can import numpy and pandas library as well to perform data mining and cleaning using these free-datasets.
Use the link given below to view the Python source code for all the examples in a IPython Notebook:
Additional Information
Publicly available datasets are also found in a few other libraries which you can explore. Examples of such libraries include seaborn, scikit-learn, statsmodel, nltk libraries.
Explore More with YoungWonks
If you're intrigued by the capabilities of pydataset and how it can be a gateway for young learners into the world of data science, discover more through Coding Classes for Kids offered by YoungWonks. Our Python Coding Classes for Kids are especially designed to introduce children to the fundamentals of programming, data analysis, and how they can manipulate data sets just like pydataset in an interactive and engaging manner. For those interested in exploring beyond Python, our Raspberry Pi, Arduino, and Game Development Coding Classes are perfect to round out a young programmer's skills, making them adept across various platforms and programming languages.
*Contributors: Written by Aayushi Jayaswal; Lead image by Shivendra Singh
